GCP Historical Background
By Roger Nelson
Formal Experiment
Methods and Data
Primary Outcome
Extended Analysis
Laboratory Research
The history of controlled laboratory research on interactions of human consciousness with physical random systems tracks the development of microelectronics and computers. The first large database experiments were conducted by Helmut Schmidt, at Boeing Laboratories, in the late ’60s and early ’70s. The number of experiments and investigators grew over the next decade, and in 1979, Robert Jahn, at Princeton University, established the Princeton Engineering Anomalies Research (PEAR) laboratory to focus on an engineering approach to the question whether sensitive electronic devices including random components might be affected by special states of consciousness, including strong emotions and directed intention. I joined the PEAR group in 1980.
REG Experiments
At the PEAR lab, the primary experiment used a custom designed Random Event Generator (REG or RNG) incorporating a well-developed commercial source of electronic white noise. This bench-top experiment provided control over parameters such as the speed and size of the samples drawn from the random sequence of bits. For example, it might be set to collect a 200 bit sample at a rate of 1000 bits per second, and to register a trial each second consisting of the sum of the 200 bits. The equipment displayed the current output trial value and a running mean as feedback to the operator. The experiment used a tripolar protocol, with instructions to maintain an intention to achieve either a high or a low mean, or to let the machine generate baseline data. Over more than a decade this basic experiment yielded an enormous database, with a bottom line indicating a small but significant effect of human intention on random data sequences. A paper describing 12 years of research at PEAR, using several different mind-machine interaction experiments, is available.
FieldREG
My job at PEAR was to coordinate the research, focusing on experimental design and analysis. An important task was to computerize the REG experiment for security and ease of data processing, and to allow greater flexibility in experimental design. I had proposed early on to record a continuously running random data stream, and to use that as a target for intention with a variety of timing and assignment schemes. Such a system was finally developed in the early 1990’s, when John Bradish built the first of a series of truly portable REG devices, and York Dobyns wrote software to record and index a continuous datastream of 200-bit trials, one per second, hour after hour and day after day. The continuous REG
was used as a direct focus for some experiments, with intentions identified in the index, but we also could mark and later analyse data collected while something else was going on in the room—another experiment, or perhaps a small, intense meeting or group discussion.
Given portable REG devices and newly available laptop computers, we were inspired to take the experiment into the field, running a modified version of the continuous software called FieldREG.
The name was a double entendre, since the purpose of the experiment was to monitor something that might be regarded as a consciousness field. The FieldREG experiment (1) did not have an intention, and indeed could be used to gather data in situations with little or no direct interest or attention from people. We looked for situations that might produce a group consciousness
because people would be engaged in a common focus, resulting in a kind of coherence or resonance of thoughts and emotions. For contrast, we identified other, mundane situations we predicted would not bring people to a shared focus. A long series of FieldREG experiments (2) produced striking, statistically significant results. As for those in the laboratory, the effects for these field
experiments are small, but they have implications of substantial importance for studies of human consciousness, assuming the results represent what we believe they do.
Prototype Global Tests
Other investigators, including Dean Radin and Dick Bierman, began doing similar field experiments looking at a broad array of situations, and we set up collaborations. For example, Dean asked some colleagues to collect data during the O. J. Simpson trial, which was expected to garner attention from huge numbers of people. The combined data from several REGs showed an impressive departure from expectation at the time the verdict was announced. Other tests looked at data taken during the Oscars, with segregation of the data into periods of strong and weak interest. Again the difference was significant.
In December 1996 I met by chance two people who were organizing a global Gaiamind Meditation.
This meeting coincided with the developing idea of attempting to register some indication of a global consciousness, making a kind of FieldREG-style group consciousness experiment in the large scale. The coincidence led me to arrange a collaboration with colleages who could record REG data that might show evidence of a consciousness field
during the Gaiamind event. The composite of data from 14 independent REG systems showed a significant effect, as detailed in a report of the Gaiamind experiment.
This work was a prelude for an attempt to register effects of the world-wide expression of compassion at Princess Diana’s funeral in September of 1997, which, coincidentally, was followed exactly a week later by the memorial ceremonies for Mother Teresa. These were prototypical global events
for the Global Consciousness Project, in that they were the focus of a great deal of attention, and especially in the case of Princess Diana, also occasions for an unusually widespread feeling of shared compassion.
Establishing the EGG Project
In November 1997, at a meeting of professional researchers in parapsychology and psychophysiology, the various component ideas for what ultimately became the Global Consciousnes Project (GCP) coalesced into a practical form. The technology was becoming available to create an Internet-based array of continuously recording REG nodes placed around the world. This would metaphorically resemble the placement of electrodes on a human head for Electroencephalogram or EEG recordings, though of course the data would not be fluctuating voltages, but randomly varying numbers. The resemblance led Greg Nelson, one of our sophisticated programmers, to suggest the network could be envisioned as an Electrogaiagram,
and we began to call it the EGG Project. We later adopted the formal name Global Consciousness Project
but continue to use an efficient terminology based on the EGG acronym and associations.
Hardware
Three kinds of random sources are used in the project. They all were developed for use in research and all are high quality sources that produce random data (bit sequences) meeting stringent criteria. The data are difficult to distinguish from theoretical expectation in calibration runs, although as real, physical devices, they cannot be perfectly random. All use a quantum level process, either thermal noise or electron tunneling for the fundamental source of random fluctuation. Each device is subjected to a rigorous calibration process based on at least one million 200-bit trials before being placed in service. They have shielding, and we also use a logical operation to eliminate bias from environmental influences such as electromagnetic fields, temperature changes, and component aging.
Software
The original software architecture for the project was designed by Greg Nelson, and refined by John Walker. It was well-considered, and has served with little modification since the beginning of the project. The primary operational software consists of two parts. At each of the host sites around the world an REG (or RNG) device is attached to a computer running the eggsh
or egg.exe
software (for Linux and Windows, respectively). The software collects one trial consisting of 200 bits each second, and stores the sum of the bits as the raw data. The indexed sequence of trials is recorded in a daily file on the host computer. The computer is connected to the Internet, and sends a packet of data at regular intervals (5 mins) to a server located in Princeton, NJ, running a program called the basket,
which writes the data as it arrives from each egg into a permanent archive. The software is open source and available for inspection.
Host Sites
When one of the qualified hardware random sources is combined with the project software running on an Internet-connected computer, we call the resulting unit an Egg,
hosted by a volunteer contributor. Host computers also run a program that synchronizes their clocks to network timeservers, to keep the independent data sequences synchronized to the second. The early egg hosts were colleagues in Europe and the US. As word of the project spread, people from other parts of the world volunteered to host an egg, and we gradually built a fairly broad geographic coverage. Approximately 40 countries are represented, in most continents, and in most timezones with substantial populations.
Data Archive
At the heart of the research project is the archival database. The raw data are stored in a binary format with header information to identify the specific source and timing for every trial. A web-based data extract form invokes scripts to decode the archive and present the specified data for inspection or analysis in a readable format. A completely normalized and standardized version of the data can be made available for well-defined research and analysis projects.
Website
The development and major features of the project are presented here on the GCP website, which is split into two tracks. One documents the rigorous scientific work we do to ensure the quality of the data and the analyses designed to identify and assess any anomalous structure that may appear in the data. The other branch presents a complementary, aesthetic approach to the project, fostering the subjective and interpretive perspectives that we believe are also valuable in efforts to study the subtle aspects of consciousness interacting with the physical world. In addition to the descriptions, the website is the repository for our primary analyses and summaries, and it provides access to the data.
Support
The GCP is affiliated with the Institute of Noetic Sciences, which manages our non-profit logistics, and hosts occasional meetings. The project has been supported from the beginning by generous contributions of time and expertise as well as money to defray expenses. A long list of people are responsible but I would like especially to note the help in various forms from Greg Nelson, John Walker, Dean Radin, Paul Bethke, Richard Adams, Peter Bancel, and Rick Berger. The full list is much longer, and includes the egg hosts as well.
The GCP Experiment
We begin the description of the Experiment with a short list of links to particular aspects. Some of this material is also found in later sections of this page, but this is a convenient menu of important items.
The GCP recorded its first data on August 4, 1998. Beginning with a few random sources, the network grew to about 10 instruments by the beginning of 1999, and to 28 by 2000. It has continued to grow, stabilizing at roughly 60 to 65 eggs by 2004.
The early experiment simply asked whether the network was affected when powerful events caused large numbers of people to pay attention to the same thing. This experiment was based on a hypothesis registry specifying a priori for each event a period of time and an analysis method to examine the data for changes in statistical measures. Various other modes of analysis including attempts to find general correlations of GCP statistics with other longitudinal variables have been considered, and continue to be developed.
Purpose
In the most general sense, the purpose of the project was and is to create and document a consistent database of parallel streams of random numbers generated by high-quality physical sources. The goal is to determine whether any correlations might be detectable of statistics from these data with independent long-term physical or sociological variables. In the original experimental design we asked the more limited question whether there is a detectable correlation of deviations from randomness with the occurrence of major events in the world.
Hypothesis
Periods of collective attention or emotion in widely distributed populations will correlate with deviations from expectation in a global network of physical random number generators.
The formal hypothesis of the original event-based experiment is very broad. It posits that engaging global events will correlate with deviations in the data. We use operational definitions
to establish unambigously what is done in the experiment. The identification of events and the times at which they occur are specified case by case, as are the statistical recipes. The approach explicitly preserves some latitude of choice, as is appropriate for an experiment exploring new territory. Accepting loose criteria for event identification allows exploration of a variety of categories, while the specification of a rigorous, simple hypothesis test for each event in the formal series assures valid statistics. These are combined to yield a confidence level for the composite of all formal trials. This bottom line
constitutes a general test of the broadly defined formal hypothesis, and characterizes a well-understood database for further analysis.
Analytical Recipes
For a more up to date discussion of formal analysis, see The GCP Event Experiment by Bancel and Nelson, 2008, and Exploring Global Consciousness by Nelson and Bancel, 2010 (in press, actually—so the link will be dead for a while).
The formal events are fully specified in a hypothesis registry. Over the years, several different analysis recipes were invoked, though most analyses specify the network variance
(Squared Stouffer Z). A few specify the device variance,
which is the inter-RNG variance (Sum of Z^2). After the first few months, during which several statistical recipes were tried, the network variance (netvar) became the standard method
which was adopted for almost all events in the formal series. The event-based experiment thus has explored several potentially useful analyses, but has focused primarily on the netvar.
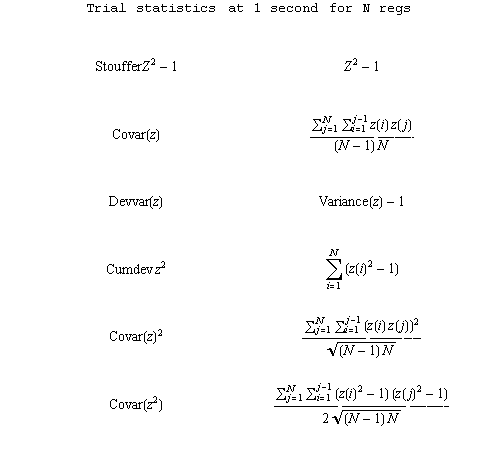
The event statistics usually are calculated at the trial level—1 second—though other blocking is possible. The trial statistics are combined across the total time of the event to yield the formal result. The results table has links to details of the analyses, typically including a cumulative deviation
graph tracing the history of the second-by-second deviations during the event, leading to the terminal value which is the test statistic. The following table shows the precise algorithms for the basic statistics used in the analyses.
Control Data
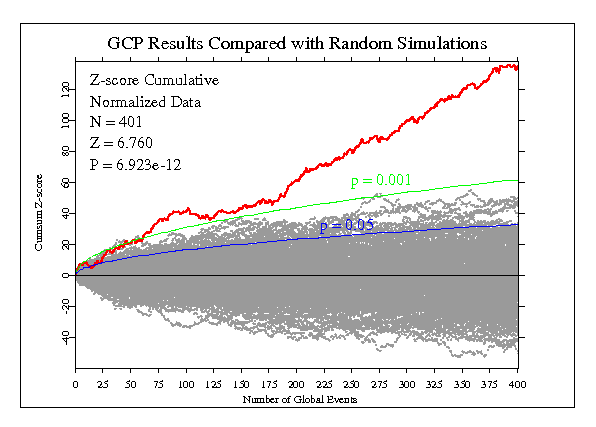
It is possible to generate various kinds of controls, including matched analysis with a time offset in the actual database, or matched analysis using a pseudorandom clone database. However, the most general control analysis is achieved by comparisons with the empirical distributions of the test statistics. The event data comprise less than 2% of the whole database, and the non-event data can be used for resampling to produce a distribution of control
events with the parameters of the formal events, but random start times. These provide a rigorous control background and confirm the analytical results for the formal series of hypothesis tests. See the figure below, created by Peter Bancel using a reduced dataset beginning December 1998 and ending December 2009, which compares the cumulative formal result against a background of 500 resampled controls.
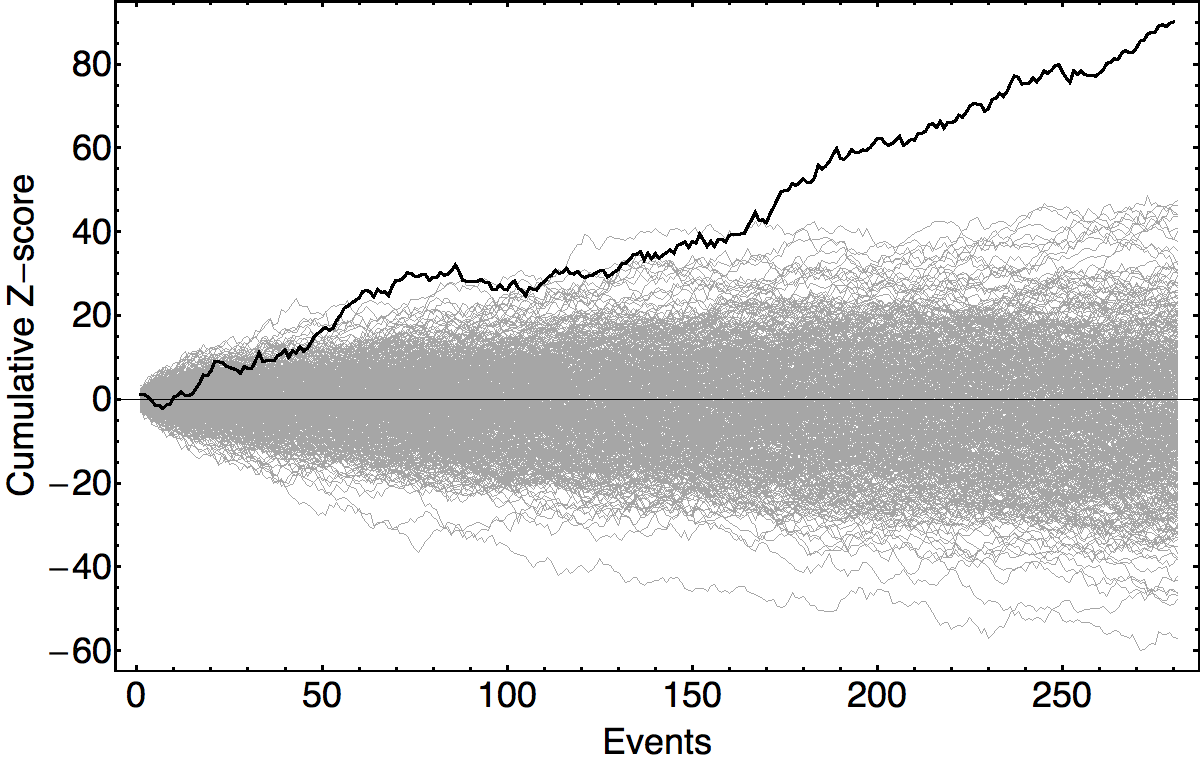
Compound Result
Over the 12 years since the inception of the project, over 325 replications of the basic hypothesis test have been accumulated. The composite result is a statistically significant departure from expectation of roughly 6 standard deviations as of late 2010. This strongly supports the formal hypothesis, but more important, it provides a sound basis for deeper analysis using refined methods to re-examine the original findings and extend them using other methods. These potentials are developed in recent papers, including The GCP Event Experiment by Bancel and Nelson, 2008. The full formal dataset as of April 2012 is shown in the next figure, where it is compared with a background of simulated pseudo-event sequences by drawing random Z-scores from the (0,1) normal distribution. As in the resampling case, it is obvious that the real data are from a different population. Note, however, that it takes a few dozen events to reach a point where the real score accumulation is clearly distinguishable from the simulations.
Sharpening the Focus
The focus of our effort turns now to a more comprehensive program of rigorous analyses and incisive questions intended to characterize the data more fully and to facilitate the identification of any non-random structure. We begin with thorough documentation of the analytical and methodological background for the main result, to provide a basis for new hypotheses and experiments. The goal is to increase both the depth and breadth of our assessments, to develop models that can help distinguish classes of potential explanations. Essentially, we are looking for good tools that will give us a better understanding of the data deviations.
Deeper Assessments
A variety of analyses have been undertaken to establish the quality of the data and characterize the output of individual devices and the network as a whole. The first stage is a careful search for any data that are problematic because of equipment failure or other mishap. Such data are removed. With all bad data removed, each individual REG or RNG can be characterized to provide empirical estimates for statistical parameters. This also allows a shift of analytical emphasis from the events to trial-level data in order to extract more structural information from the database. The approach is to convert the database into a normalized, completely reliable data resource that facilitates rigorous analysis. The trial-level data allow a richer assessment of the multi-year database using sophisticated statistical and mathematical techniques. We can use a broader range of statistical tools to look for small but reliable changes from expected random distributions that may be correlated with natural or human-generated variables.
Real Devices vs Theory
Ideally, the trials recorded from the REGs follow the binomial [200, 0.5] distribution, with expected mean 100, variance 50. However, although they all are high-quality random sources, perfect theoretical performance is not expected for these real-world devices. A logical XOR of the raw bit-stream with a fixed pattern of bits with exactly 0.5 probability compensates mean biases of the regs.
After XOR’ing, the mean is guaranteed over the long run to fit theoretical expectation. The trial variances remain biased, however. The biases are small (about 1 part in 10,000) and generally stable on long timescales. We treat them as real, albeit tiny biases that need to be corrected by normalization for rigorous analysis. They are corrected by converting the trialsums for each individual egg to standard normal variables (z-scores), based on the emprirical standard deviations.
Deeper Analysis of the Event-based Experiment
The normalized and standardized data resource allows us to do a rigorous re-analysis of the experiment. The result is little different from the original analysis, but provides confidence in the foundation for new analytical investigations. These include the development of orthogonal, independent measures of structure in the event data, and examination of questions of temporal and spatial structure implicit in the general hypothesis. A 2008 assessment is detailed in The GCP Event Experiment by Bancel and Nelson, Journal of Scientific Exploration, March 2008.
