Special New Years analysis.
This year again we use the longstanding predictions of a meanshift (squared Stouffer Z) during 10 minutes surrounding midnight, and a variance decrease with a minimum at midnight. These two measures have been assessed for each New Year since 1998-1999, a total of 17 years.
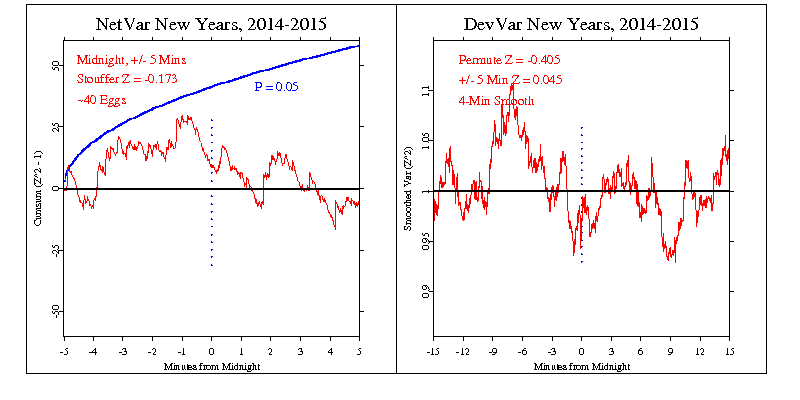
The probability for the squared Stouffer Z for this year is p = 0.568 with Z = -0.173, which is opposite to the standard prediction. For the Variance decrease, a comparison with the distribution of 10000 permutations of the data indicates a modest probability of 0.657 and Z = -0.405 which is opposite to the prediction. A simpler calculation of the variance deviation during the 10-minute period surrounding midnight yields a tiny positive Z of 0.045.

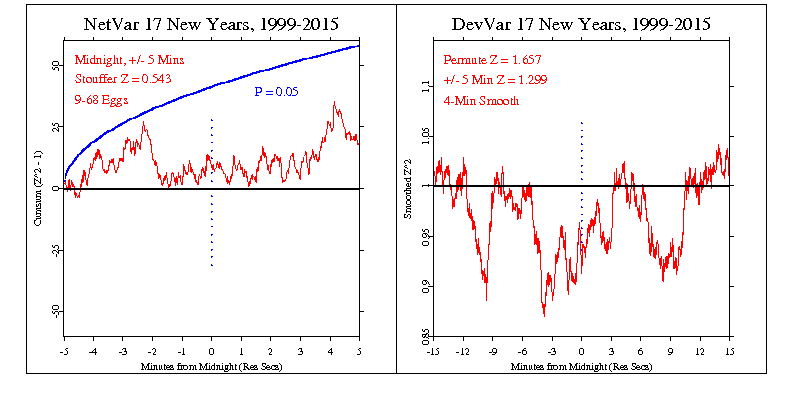
In addition to the two figures above representing the results for the current year, a composite over the 16 years is shown for the two measures. The meanshift is slightly positive, with p = 0.293 and Z = 0.543. But the variance decrease prediction calculated by permutation analysis is more strongly supported with a p-value of 0.045 and Z=1.657. A simpler calculation addresses the implicit prediction that the variance will be low around midnight. If we look at midnight +/- 5 minutes, the deviation is similar, with a somewhat smaller estimated Z-score of 1.299.

Interpretation
The left hand graph shows the second-by-second accumulation of small deviations of the data from what’s expected. Our prediction is that deviations will tend to be positive, and if this is so, the jagged line will tend to go upward. If the endpoint is positive, this is evidence for the general hypothesis and adds to the bottome line. If the endpoint is outside the smooth curve showing 0.05 probability, the deviation is nominally significant. If the trend of the cumulative deviation is downward, this is evidence against the hypothesis, and is subtracted from the bottom line.
The right hand graph shows the composite across all timezones of a 30-minute period surrounding midnight, plotting the device variance. The prediction is for the variance to decrease as we come closer to midnight and then return to normal. Ideally we predict a v-shaped curve with the minumum point close to midnight. The statistical measure is a combination of the depth of the minimum and its distance from midnight, using 10000 permutations of the data to obtain the expected distribution parameters.
For more detail on how to interpret the results, see The Science and related pages, as well as the standard caveat below.
Exploration: Full GMT day
A simpler analysis looks at the whole GMT day from noon, Dec 31 2014 to noon Jan 1 2015, which of course includes most of the New Year midnights along the way. This analysis uses exactly the same processing and statistics as most of our events, thus also making it easier to validly combine with the primary database. It is interesting this year, giving a much more positive result than the preplanned formal analyses. Note, however, that since this was not the pre-specified hypothesis test, the result is not included in the formal statistics.

Standard caveat
It is important to keep in mind that we have only a tiny statistical effect, so that it is always hard to distinguish signal from noise. This means that every success
might be largely driven by chance, and every null
might include a real signal overwhelmed by noise. In the long run, a real effect can be identified only by patiently accumulating replications of similar analyses.
