Comparing Alternate Seconds in 9/11 Data
In their last word
in a paper entitled The Global Consciousness Project, Identifying the Source of the Psi: A Response to Nelson and Bancel in preparation for publication in the Journal of Scientific Exploration, May and Spottiswoode opine as follows:
There is, however, one simple thing that can be done from this point forward that would go a long way to answer the questions raised in our debate. Rather than posting the GCP data for every second, post only, say, the even-numbered seconds. Then data snoopers and data-mining programs can be unleashed with impunity to isolate events that show significant correlations. Among the things we have stipulated is the excellence of the RNG hardware, which means the autocorrelation of non-zero lags is statistically zero. In simple language this means that the data from second to second are independent of each other under the null hypothesis of no effects. When the data mining produces a significant effect on the even-numbered seconds, it must also be seen nearly exactly on the odd-numbered seconds which now act as a formal
within sessioncontrol. Any causal or correlational effects should replicate on a second-by-second basis.
This proposition is simple and easy to understand, and has the further merit that it is in principle easy to check out. As always, however, there are devilish details, which in this case have to do with the blithe disregard of the signal to noise ratio which we know from years of work with this database (indeed any RNG-based psi research) is very small. The evidence clearly indicates effects are much too small to support the M&S prediction that a significant effect on the even-numbered seconds must also be seen nearly exactly on the odd-numbered seconds. In addition, while M&S make a confident sounding statement, they do not offer any procedure for testing it. Here we take an exploratory look at some possiblities.
We know that the average effect size per event is about a third of a standard deviation, which directly implies that we must look at dozens of events comprising 50 or 100 total hours of data to get reliable statistics. It makes sense that a subset of events with unusually strong effects might improve the situation, though it is disingenuous to postulate that causal or correlational effects should replicate on a second-by-second basis. Nevertheless, it seems worthwhile to take a look at a comparison of odd and even seconds in the data for a particularly strong case. This is supported by results from unpublished analyses done several years ago by Peter Bancel, which showed a weak positive correlation for the alternate seconds during events.
In some respects, the terror attacks on September 11 2001 are almost uniquely suited to serve as a sample. The data around the event have been studied more deeply than any other in the database, and there is good evidence of a true effect, not just random fluctuation. We begin with a direct assessment of the question whether odd and even trials (seconds) might be correlated.
The raw data for a selected period showing consistent deviation starting a few hours before the attacks and continuing for two days show a marginally significant correlation. Table 1 presents the results for a linear regression of odd seconds on even seconds for the period beginning roughly 2.5 hours before the first plane hit the WTC and continuing for about 48 hours.
                                        Table 1
[ 1]
[ 2] A  N  O  V  A                   SS      df     MSS    F-test   P-value
[ 3] ______________________________________________________________________
[ 4] Regression                     4.015     1     4.015   1.972   0.1603
[ 5] Residuals                 193440.129 94999     2.036
[ 6] Total Variation           193444.143 95000     2.036
[ 7]
[ 8] Multiple R      = 0.00456
[ 9] Rˆ2             = 0.00002
[10] Adjusted Rˆ2    = 0.00001
[11] Standard Error  = 1.42697
[12]
[13]
[14] PARAMETERS         Beta         SE         StandB     t-test   P-value
[15] _____________________________________________________________________
[16] b[ 0,]=          0.0120       0.0046       0.0000      2.603   0.0092
[17] b[ 1,]=         -0.0046       0.0033      -0.0046     -1.404   0.1603
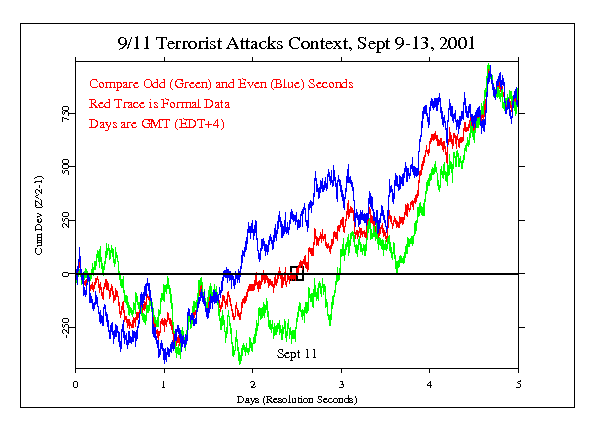
One of several graphical explorations looks at data surrounding the infamous day using the formal measure of network variance, which is equivalent to excess pairwise internode correlation. This measure shows persistent deviation from expectation not only during the specified time of the formal event, but for roughly two days following the attacks. The figures below show some analyses of the data for five days centered on 9/11, assessing the odd and even seconds.
First we present the cumulative deviation
of the network variance which is the formal measure for this and the majority of GCP events. This calculation presents the cumulative sum of positive and negative departures from expectation. The slope of the trace is equivalent to the average deviation, and its terminal value is the bottom line
for a hypothesis test (assuming a formal hypothesis, which is not available for this exploration).
It is easy to see that the odd and even second traces track each other fairly well, and that they obviously compose the original trace using all data contributing similar amounts to its slope. But we should note that because such a graph is autocorrelated (each data point includes all the preceding ones) it is difficult to interpret. We look at an alternative presentation in the following figures.

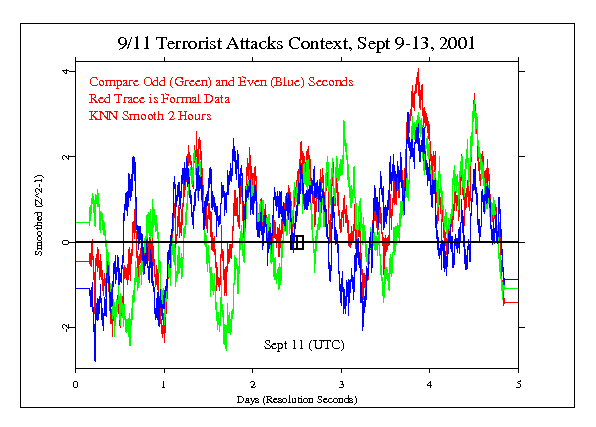
If we look at the raw data, the noise is so overwhelming that no pattern or trend at all can be seen. An approach that has some value in such a case is smoothing, or averaging the data in a moving window, thus washing out some of the noise but allowing trends that may represent signal or structure to emerge. The following figure shows the same data as above, smoothed via a 2-hour sliding window. The graph does show some visible correlation of the odd and even traces, especially in the second half. They should be completely independent, as M&S stipulate in their paper, but it looks like there is substantial tracking — in other words the two datasets behave as if both are affected by a common agency.

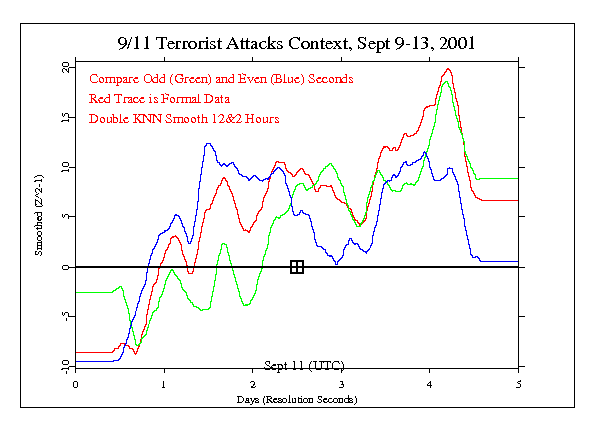
In the next figure we use a much longer averaging window of 12 hours, supplemented by a second smoothing process that takes out the high frequency noise. The result is a very simple reading of the average size and direction of deviations over the several days of data. We see some degree of consistency in the data of the odd and even subsets. The traces begin to track each other and they both remain in positive deviation territory after the terror attacks.

The following standard caveat for all our analyses is particularly applicable here, as explained above. In addition, we must depend on visual comparisons for assessment of the similarities and differences since we do not have a solid formal hypothesis nor any simple estimate of likelihoods for the significance of trends.
It is important to keep in mind that we have only a tiny statistical effect, so that it is always hard to distinguish signal from noise. This means that every success
might be largely driven by chance, and every null
might include a real signal overwhelmed by noise. In the long run, a real effect can be identified only by patiently accumulating replications of similar analyses.
