|
This page is a working document and is
not to be
quoted or referenced
Alternate Measures
The formal analysis shown in the main Election 2008 page
is based on network variance (Netvar)
but our extended analysis program includes other
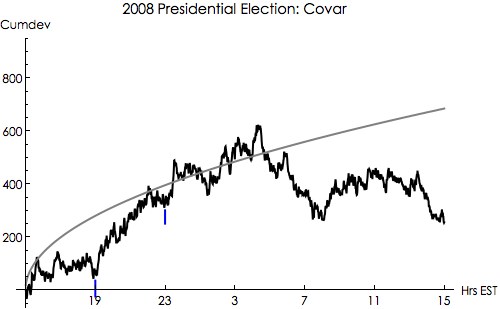
measures. The independent Covar statistic addresses the
variance of inter-reg correlations, and has a different
spectrum of response to some categories of events. For events
identified as celebrations, the Covar tends to yield a
larger effect than the Netvar measure. This analysis is
applied to the formal dataset for the election
with the result shown in the following figure. The blue
tic-marks show the first results at 7:00 pm ET, and the
declaration that Barack Obama had won at 11:00 pm. Obama
spoke at about midnight. The "celebratory" trend continues
until about 04:00 ET.
As we have seen for other celebration events, the Covar does
show a larger response than the Netvar.

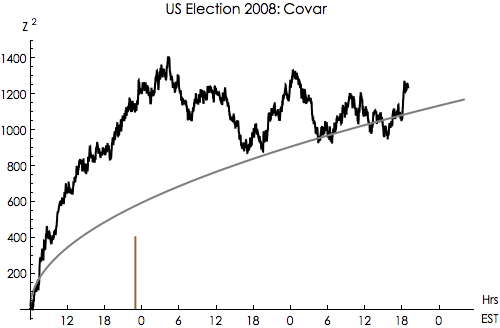
If we take the Covar result for the whole day of the
elections, which begins at 06:00 Eastern Standard Time, we
see that the cumulative deviation shows a very steep slope.
By the time the outcome is clear, Obama has given his
speech and several hours of ongoing celebration have been
underway the departure reaches approximately 3 Sigma.
Then at about 04:00 the data return to the normal
character of a random walk. The time of the declaration for
Obama at 11:00 ET is marked with a vertical line.

Another independent measure is the momentary absolute variance among
the REG devices (Devvar). The following figure shows a substantial
increase in the Devvar beginning at 17:00 ET, 6 hours prior to the
announcement that Obama had won the election, peaking about
2 hours prior to the announcement. The variance
then shows a decreased level for a few hours before resuming
normal fluctuation around expectation.
(This analysis is preliminary, and will be replaced as time
allows.)

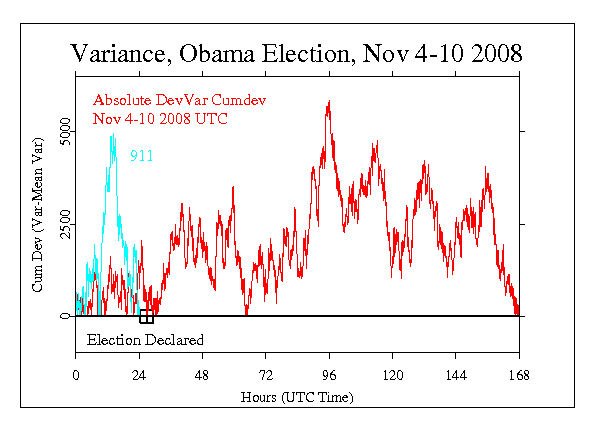
Here is the same analysis extended over a week beginning
with Nov 4. This is the device variance plotted as the
accumulated deviation from expectation. In the following
figure, the mean of this dataset is used to estimate
the variance of the REGs.
Beginning roughly a day after the election, the deviation of
the variance is persistenly large for about two days, after
which it resumes the expected level random walk.
For a comparison, please note the plot (in green) of
this same measure using data from Sept. 11 2001, which up to
that time showed the most extreme device variance excursion
in the database.
We will later have more precise assessments, but as of Nov
16, this is a reasonable picture of what the
device variance did over this period of time. There
is little question that it was not random, but
interpretation must remain difficult. The world situation is
hugely complex, with wars and misery in the middle east and
Africa, and the economy in dire straits in most countries.
The timing relative to the election of Barack Obama is
striking, but not definitive.

Return to Obama
election page
|