|
On Mon, 12 Nov 2001, Nick Reiter wrote to
ask if I could explain what was happening on the real time display of
egg data, which looked unusual to him. He said that he
was watching due to the unfolding tragedy of the plane crash in
Queens. I responded that I intended to make a formal prediction for
the event, and asked if he would be so kind as to get the real times for
the accident and a reasonable guess about the end of the high
concern period (while people were thinking O God, another
attack).
I proposed a period lasting for two or three hours, or however long it
had taken for people to become fairly certain it was an accident.
The newswire and media references cited the crash as happening
at 0917 EST. Rick said his own guess was that the period of
highest anxiety would extend from about 0945 EST to perhaps 1500 EST.
By that time, it seemed like there were quite a few references to
the FAA and FBI stating that it was unlikely that a terrorist bomb
was involved. I told Rick I heard reference while I was driving home
at about 13:30 to increasing confidence that it was an
accident, and asked if he "would be comfortable with a period from 09:00
to noon? Or do you feel it should go on to 15:00?"
He said 0900 would be a good starting point, but that we might want to
extend the period of prediction / analysis out to 1300, just to
capture what may have been the people tuning in at lunch to hear
something hopeful.
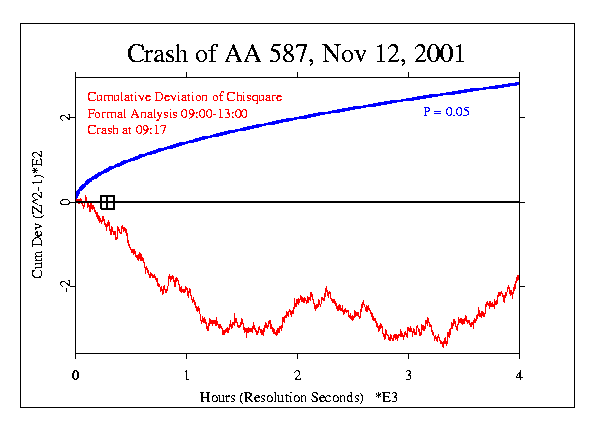
The result is a striking downward trend that continues for about 1.5
hours, then levels off for the rest of the prediction period. The final
Chi-square is 14219 on 14400 df, with p = 0.857, which reflects the
very strong slope during the first hour or so after the crash.

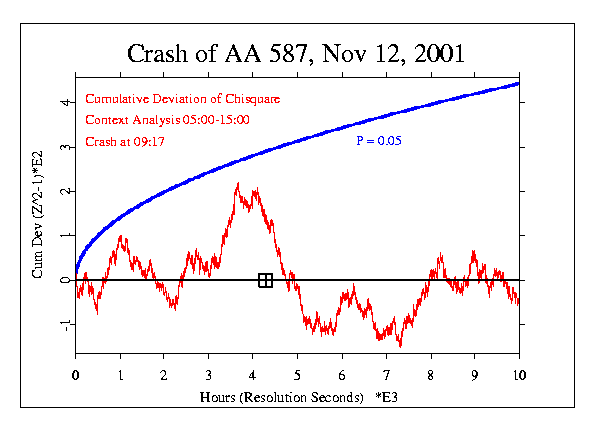
For context, the next figure shows the data from 05:00, some four hours
before the crash, until 15:00, by which time most people had stopped
worrying about another terrorist attack.

|