| Explorations, Learning Exercises |
| Other explorations of statistics and graphic approaches are intended to help visualize GCP effects. We are working to develop a standard set suitable for the analysis and display of most events. |
BOMBING
IN YUGOSLAVIA
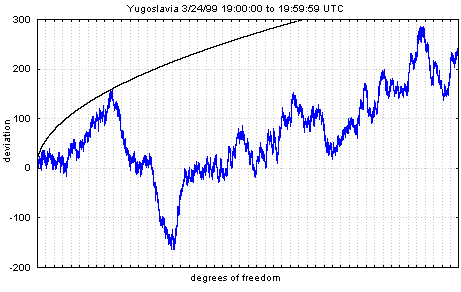
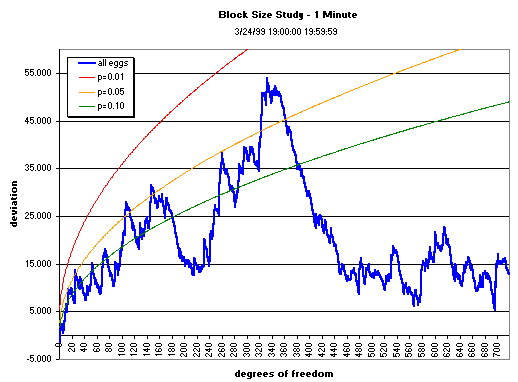
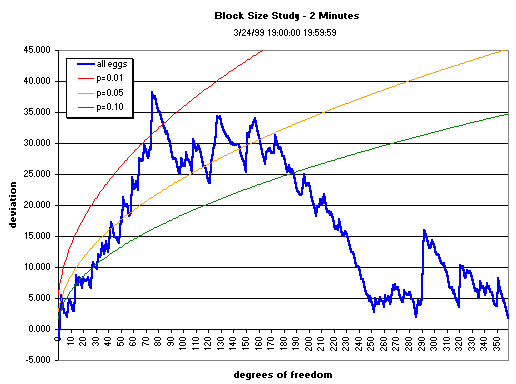
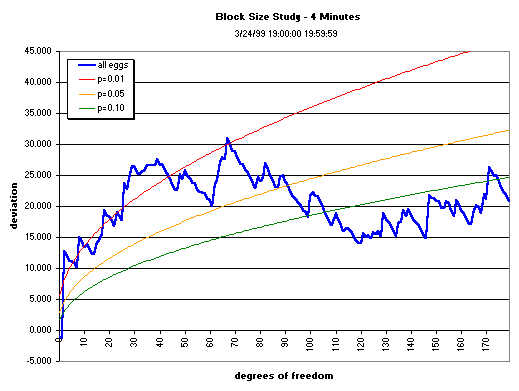
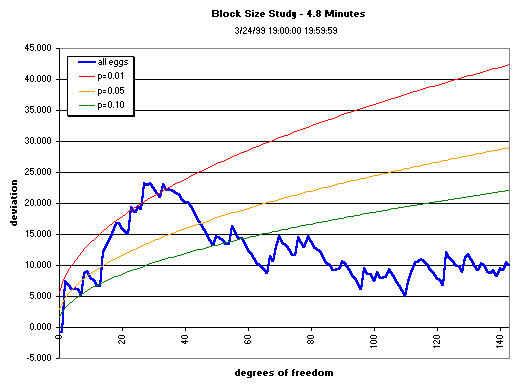
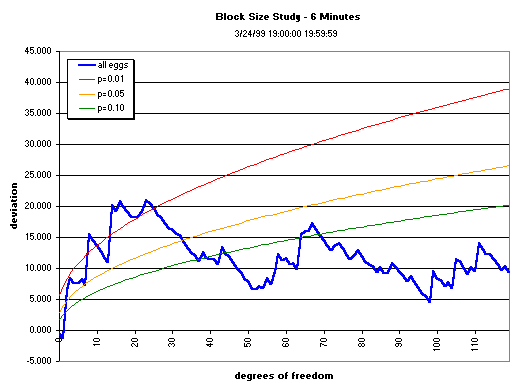
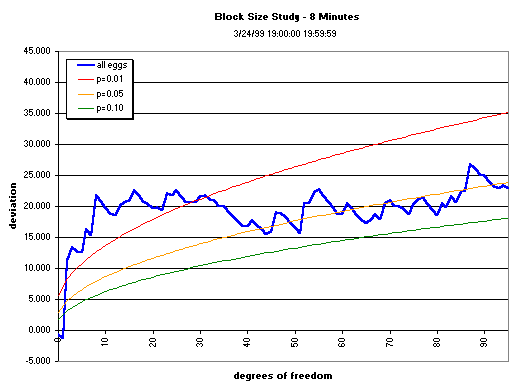
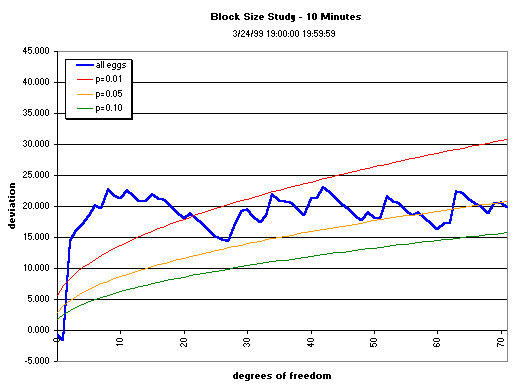
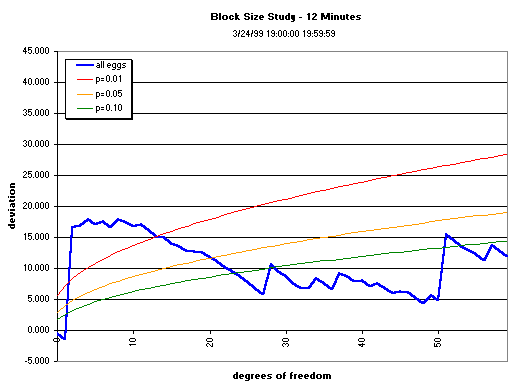
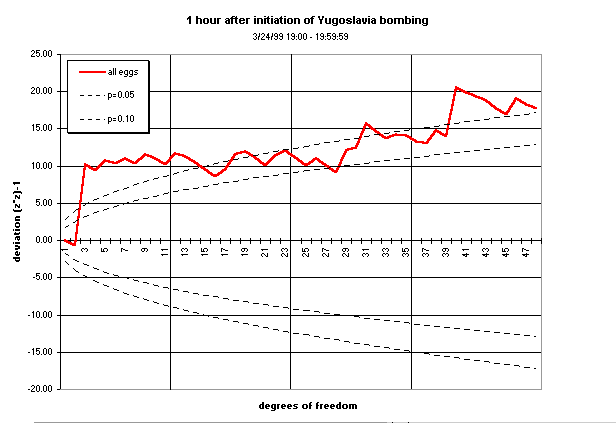
Block Size ComparisonsThe graphs below show the cumulation over various data segment lengths (block sizes) of the composite across the squared, normalized deviations of the 12 eggs running during the first hour of bombing in Yugoslavia. The block size is varied to see whether there is an optimum, ranging from the raw, 1 trial per second data through 1- to 12-minute blocks, with the original 15-minute block-size graph shown for comparison . The cumulative deviation of Zē (Chisquare) relative to expectation (horizontal line) for the first hour of the bombing shows a trend (the jagged blue or red line), culminating with a mean value that may or may not be significant. The parabolic curves show either the p = 0.05 or p = 0.10, p = 0.05, and p= 0.01 "significance" envelopes for the Chisquare as the number of degrees of freedon increases.First, the raw data, one trial per second. We see a modest positive trend that does not approach significance. Note, however, that in this trace as in all the following exploratory blocking examples, the first 10 to 15 minutes do show a consistent trend, which, by itself is significant, even highly significant in all cases.
Other explorations of statistics and graphic approaches are intended to help visualize GCP effects. We are working to develop a standard set suitable for the analysis and display of most events. (July, 1999, RDN, Graphics by George deBeaumont).
|
