|
The primary analyses for New Years 2003-2004 are complete as
of January 2nd, 2004. All of the current array of active eggs have
reported as of this date, with 54 eggs archived on December 31 and 54 on
January 1.
The formal analyses are based on the fully detailed data, with
1-second resolution. Although a few eggs are not synchronized to the
second, their mis-synchronization has only a conservative influence, so
all eggs are included in the analyses.
The composite across timezones specified for the last two years
is used again. (The procedure for the composite is
signal averaging like that used to reveal non-random structure in brain
electrophysiology, for example, in examining evoked potentials.)
A simple picture of time differences around the world assumes 24
timezones, but the formal analysis is based on
37 official timezones, from -14 to +12 hours from GMT, including 10
zones with half-hour offsets.
-
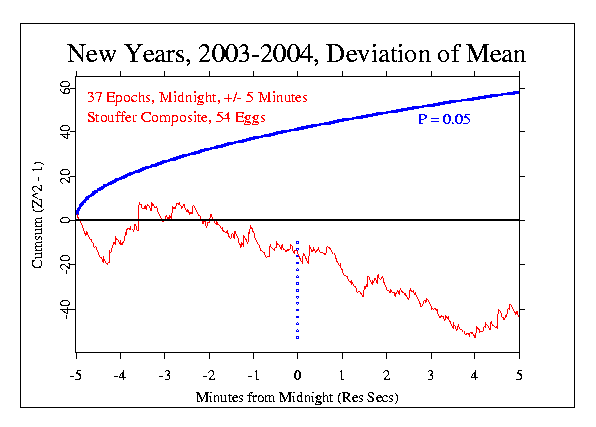
The 10 minute period surrounding midnight, which corresponds to
the first of the formal predictions, shows a strong negative trend,
with Chisquare = 556.7 on 600 df, p = 0.897.
The following figure shows the data for the formal
prediction. The trend is fairly steady, especially in the range of
midnight ± 3 or 4 minutes. Because the meanshift prediction is
for a positive trend, the opposite result is not readily interpretable.
In our long-term "meta-analytic" composite, this result subtracts from the
accumulated evidence for an effect of global events.

-
The second of the formal predictions for New Years 2003-2004 is based on
earlier years, beginning with the prediction of reduced variance near
midnight on Y2K.
To test it, the variance across eggs is normalized as Z-scores for each
second, then the sequence is smoothed and plotted.
The prediction for this event specifies that the variance will depart
from expectation, with a maximum deviation near
midnight, and then return to normal.
While the prediction for Y2K was a reduction of variance near midnight,
in subsequent years the formal prediction has been two-tailed.
Thus, either a reduction or increase in variance, if substantial and
focused, can be regarded as evidence of an effect.
In contrast to last year, but in concert with
1999-2000, 2000-2001, and 2001-2002, there is compelling evidence for an
alteration of the variance around midnight.
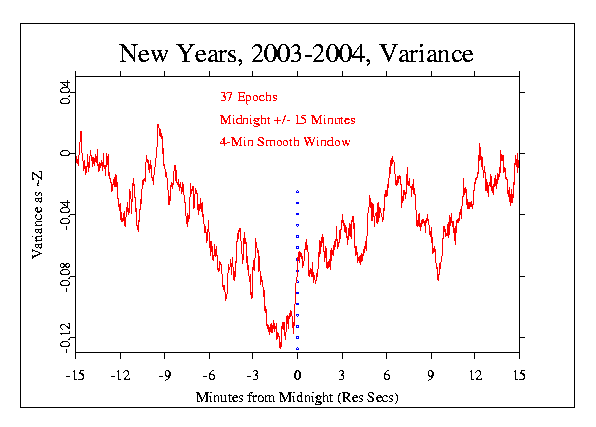
The figure shows a half-hour period centered on the New Year celebration.
The sequence of Z-scores is
smoothed with a running mean (moving average) using
a four-minute window of 240 points, following the precedent of the
previous years.
The red curve is the running mean (moving average) of the normalized variance.
The data show a clear reduction
of the variance around midnight, with the maximum deviation
about one minute before the hour.
An estimate for the likelihood of the apparent structure
is calculated using a permutation procedure.
The original data are variance calculations across the 54 eggs, for each
second. The variances (as Z) for midnight ± 30 minutes
are then signal averaged (superimposed)
across the 37 timezones to make
a second-by-second composite value surrounding "midnight" as it is
experienced around the world.
To estimate the likelihood of the variance change
near midnight, the signal averaged data
were randomly permuted 10000 times.
Only 390 permutations have a maximum deviation closer
to midnight than the original data, shown in the figure.
The corresponding probability is thus p = 0.039.
The permutation analysis estimating the likelihood of the maximum
deviation shows that although it is visually impressive, it is not rare
to have a deviation this large.
In 10000 cases, 4680 had a larger deviation somewhere
in the hour long period surrounding midnight (p = 0.468).
When the measures of proxmity and magnitude are
combined, the resulting probability is 0.018.
This is the 6th New Year for which we have GCP data, and this is
the 4th time the data look like the following figure, with a rather
clear decrease in variance around midnight.
In one of the two remaining cases, there is a strong increase in
variance, centered exactly on midnight. Only one of our six New Years variance
calculations appears to be actually random.

|